Work Samples
1. Sales Success Prediction
Performed an end-to-end exploratory and predictive analysis of sales data using Python and Power BI, aimed at understanding key drivers of sales success and assisting decision-makers in refining marketing and outreach strategies.
ABC Pvt. Ltd. (name anonymized) manufactures a Dual Fuel System (DFS) for diesel generators, which improves operational efficiency by enabling the engine to use both diesel and natural gas as an energy source. The product is relevant for regions with stringent emission norms, offering a cleaner and more compliant energy solution.
The analysis was mainly done in the Delhi NCR region, where regulations in respect to air pollution (e.g., GRAP) significantly influence generator operations, especially during the high-pollution months (October to January). Sales operations were divided among three salespersons. While all shared comparable experience levels, differences in performance pointed to other influencing factors.
The client base was diverse, including:
- Residential Complexes – high-rises and apartment buildings
- Industrial Units – factories and manufacturing facilities
- Commercial Office Spaces – corporate buildings and commercial parks
Data Engineering & Feature Creation
- Created derived features such as Amount per kVA, Is_Dealer, Is_Quarter_End, and Location_Amount_Ratio to capture domain-specific patterns.
- Defined a custom ‘Success’ label by benchmarking sales amount against median value per kVA rating, improving the reliability of downstream modeling.
- Cleaned categorical variables and resolved inconsistencies (e.g., duplicated or mislabelled locations such as “Noida” vs “GB Nagar”).
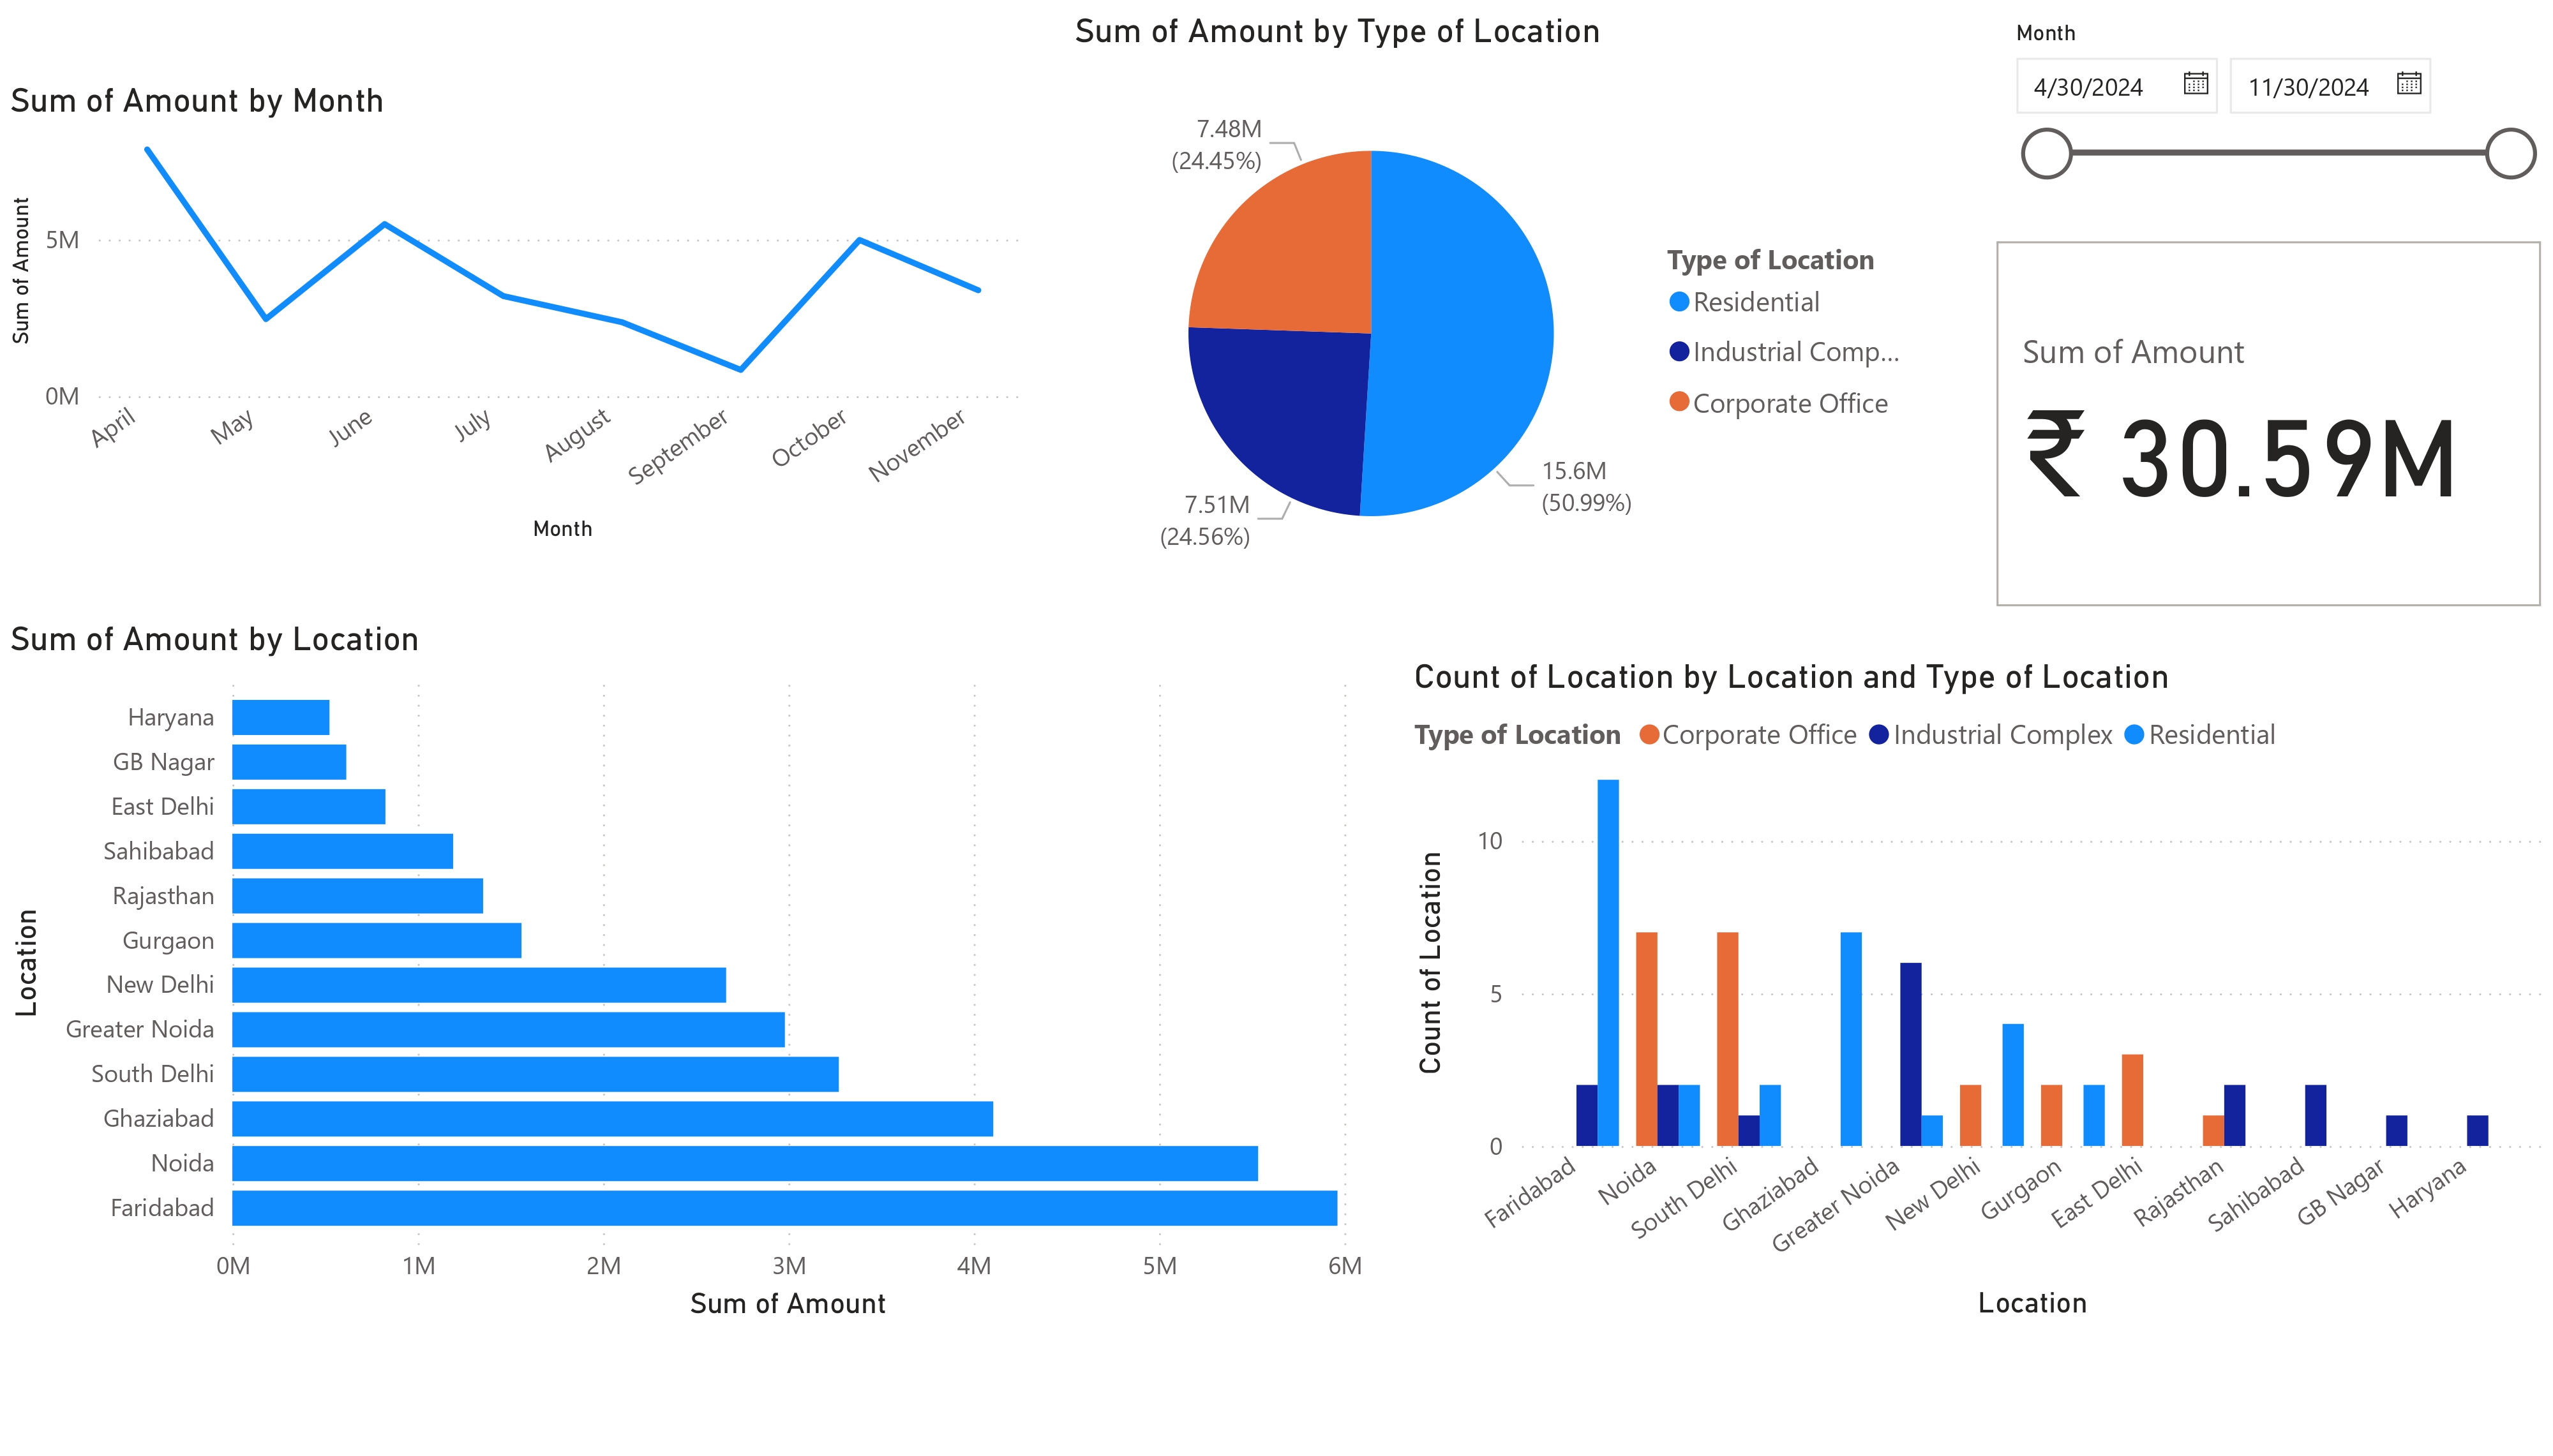
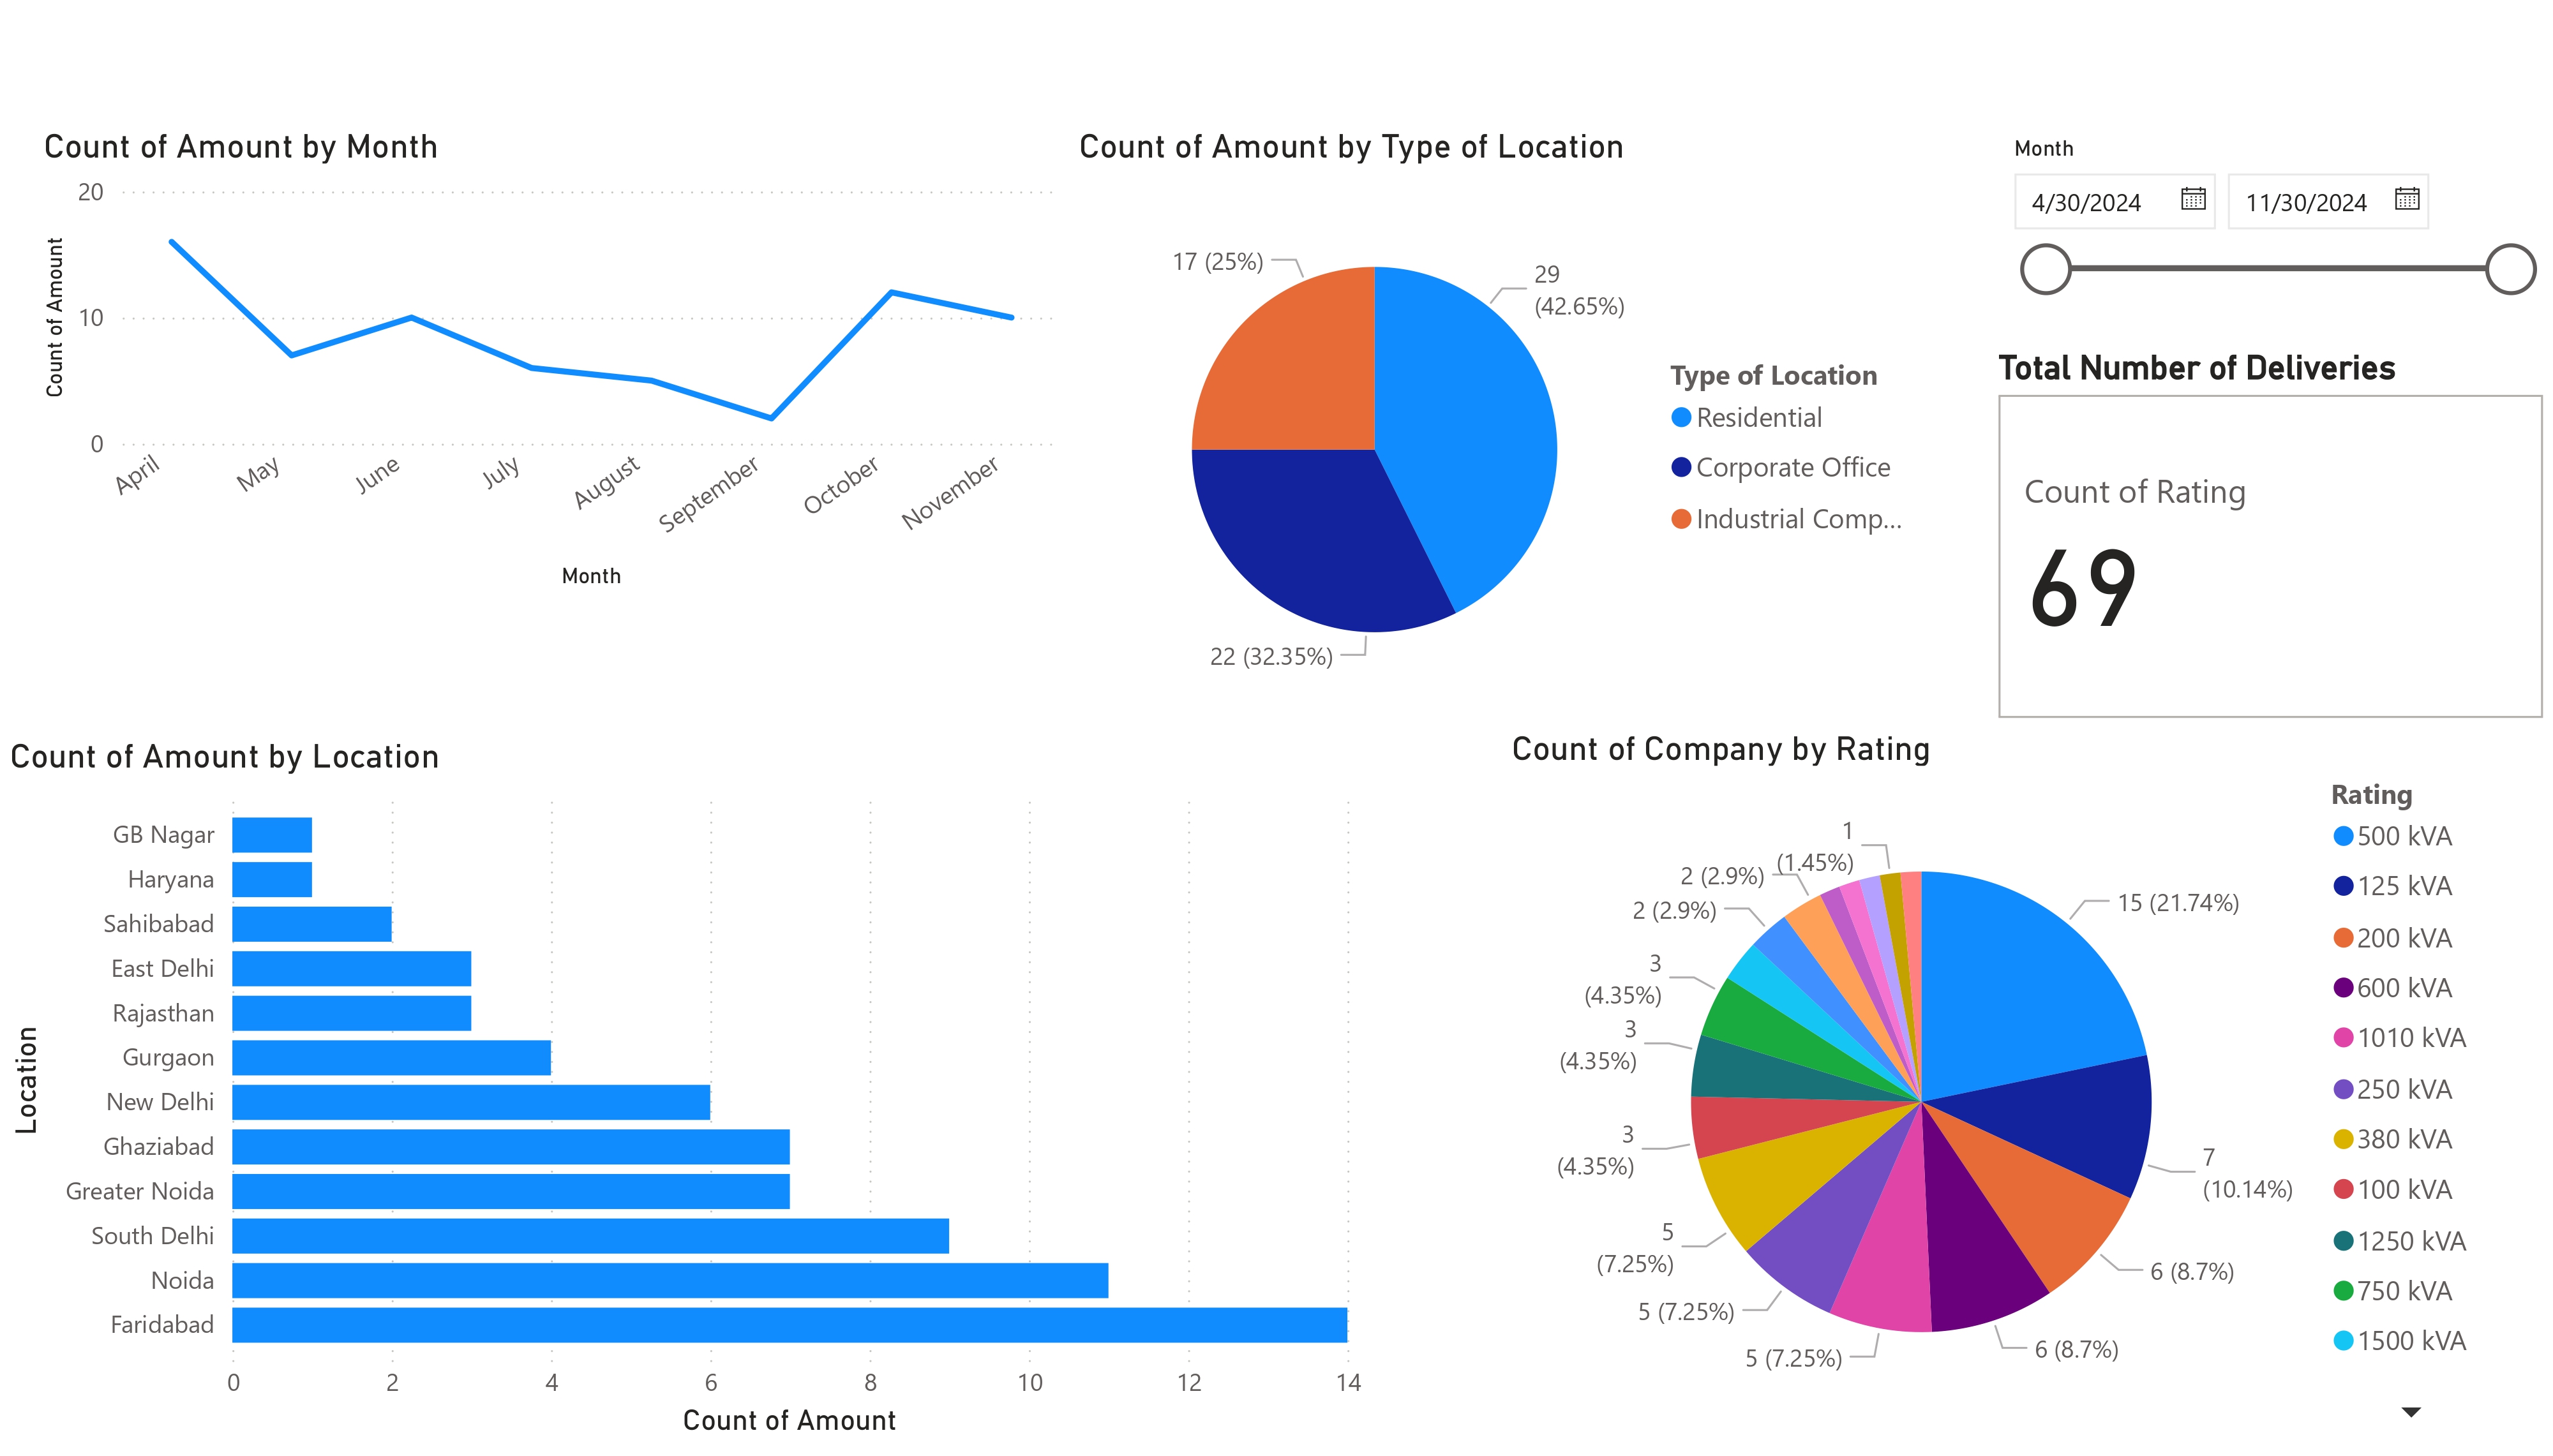
Key Business Insights
- Sales saw seasonal spikes in the months preceding expected GRAP restrictions, particularly in October and March.
- Locations like Noida, Faridabad, and South Delhi showed higher volume or value sales, pointing to a more regulation-aware or industry-heavy clientele.
- Success was not linearly correlated with generator capacity (kVA), suggesting that instead of the genset capacity, compliance urgency and client type played a larger role in successful sales.
- Dealers accounted for fewer sales but often had higher value transactions.
- Salesmen A and B handled most of the high-value and successful transactions, while C saw more mid-value and inconsistent results—possibly due to lack of experience.
Model Performance
Tested multiple classification models to predict sales success. Below are ROC-AUC results:
- Gradient Boosting: 0.95 (Test), 0.74 (Cross-Validation)
- Random Forest: 0.90 (Test)
- Logistic Regression: 0.84 (Test), 0.75 (Cross-Validation)
Gradient Boosting was the best test performer. However, Logistic Regression had more consistent performance across folds, highlighting a balance of accuracy and generalization. Feature importance confirmed that Location, Client Type, and Amount per kVA were critical in predicting outcomes.
2. SpaceX Falcon 9 Launch Analysis & Prediction
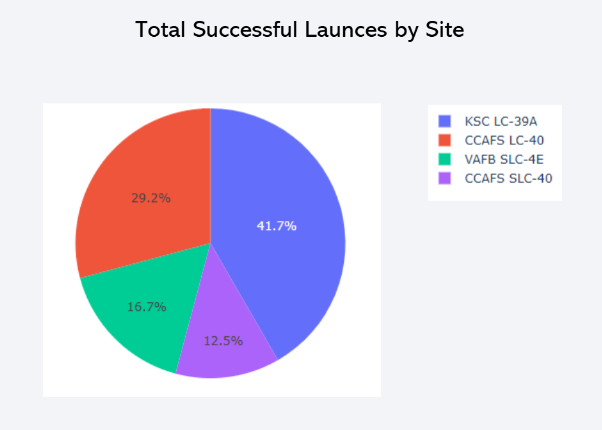
Analyzed SpaceX Falcon 9 missions using Python, Plotly Dash, and scikit-learn to explore launch behavior and predict landing outcomes. This project was part of the Capstone Project for completion of the IBM Data Science Professional Certificate (V3). Here are some of the observations:
- KSC LC-39A emerges as the most successful launch site.
- Lower payloads are strongly associated with successful landings.
- Orbits such as GEO, HEO, SSO, and ES-L1 achieved 100% success rates in the dataset.
- Launch sites are strategically positioned near coastlines and close to the equator.
Predictive Modeling:
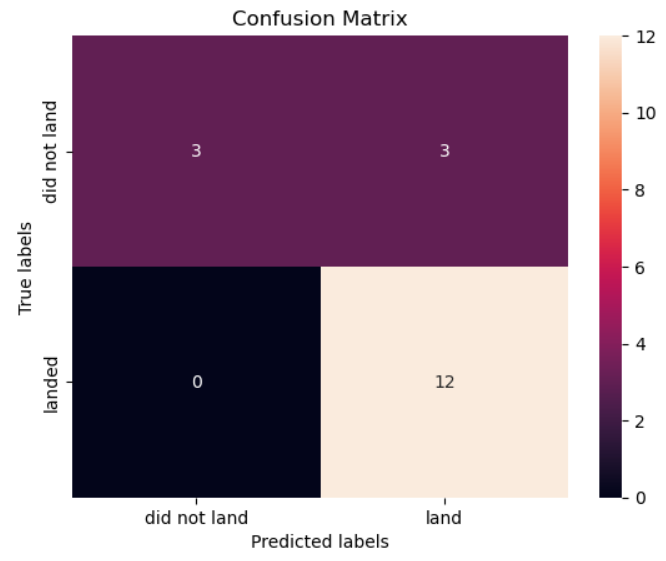
- Trained Logistic Regression, SVM, Decision Tree, and KNN models.
- Logistic Regression and SVM both achieved test accuracies of ~83%.
- Cross-validation confirmed ~80% average accuracy, ensuring model reliability.
- Confusion matrix highlights strong performance by Logistic Regression with very few false negatives.
Conclusion:
Landing outcome prediction is highly feasible using publicly available data. Launch cost estimation is also possible to a certain degree using features like orbit type, payload mass and other such relevant factors.
3. Student Grade Prediction
Conducted an end-to-end analysis using Python and regression modeling to predict academic performance for B.Sc. students (Computer Science, Statistics, and Mathematics). The goal was to recognize patterns that could guide early academic intervention and improve learning outcomes.
Data was collected anonymously from students in the Department of Mathematics, Chandigarh University, who were in their 5th semester of courses with common subjects, ensuring privacy and minimizing response bias. The study considered living situations, past educational background, attendance, and self-reported engagement levels to assess predictors of CGPA.
Data Engineering & Feature Creation
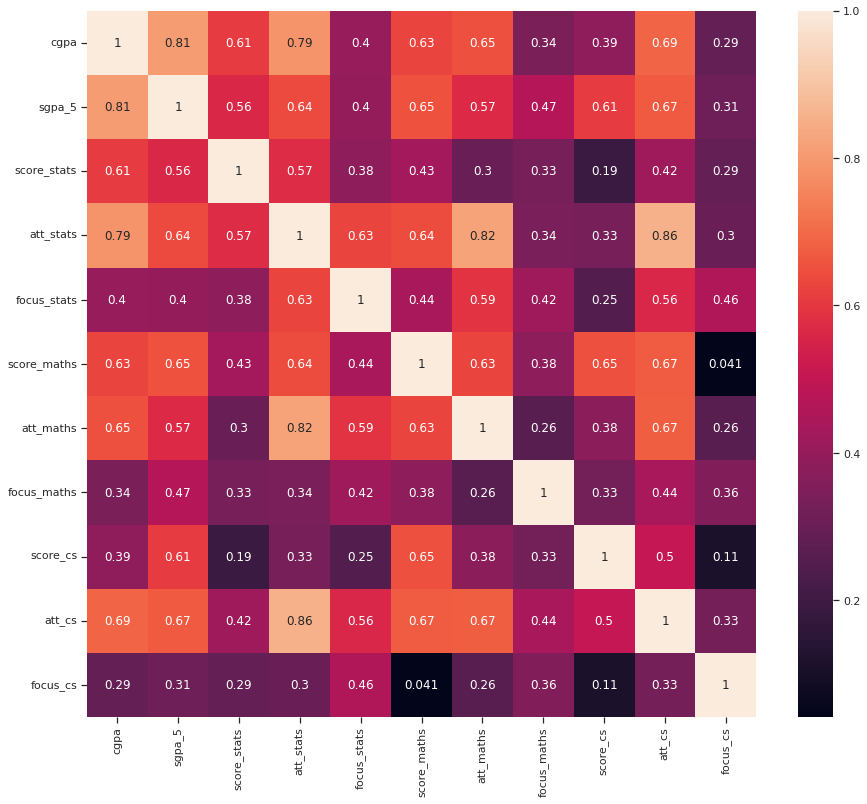
- Captured 14+ features including location, gender, education board, attendance, and focus scores (1–10 scale).
- Applied Binary Encoding for categorical variables and introduced derived features like Living Category to capture lifestyle impact.
- Eliminated low-correlation features (threshold: 0.12) to prevent noise and overfitting.
Key Insights
- Living Arrangement: Day Scholars had a better CGPA score on average, followed by Hostel/PG, and then Flat residents.
- Board Impact: Students from State Boards outperformed ICSE and CBSE counterparts.
- Focus vs. Attendance: Focus scores were stronger predictors than raw attendance, indicating quality > quantity.
- Gender: No statistically significant difference in academic performance across genders.
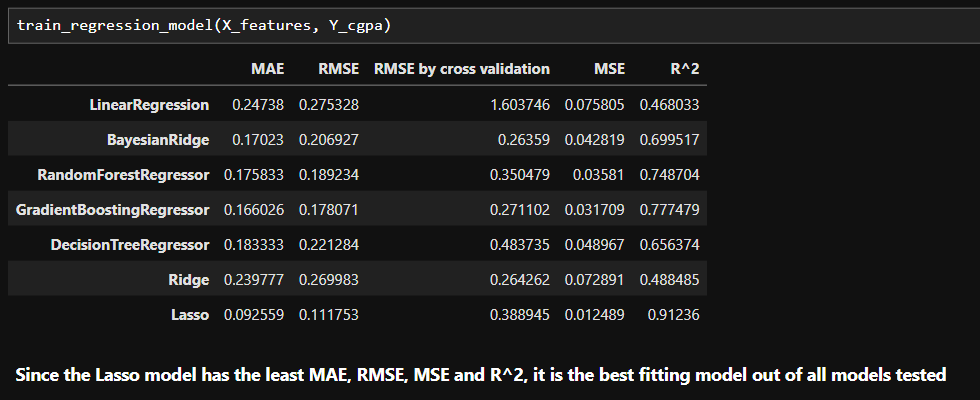
Model Performance
- Lasso Regression (Best Performer): R² = 0.912, MAE = 0.093, RMSE = 0.112
- Gradient Boosting: R² = 0.777
- Random Forest: R² = 0.749
Lasso regularization improved model interpretability and minimized multicollinearity, while still capturing over 91% variance. Cross-validation confirmed its robustness with low error margins.
Applications
- Academic Risk Monitoring: Helps identify at-risk students as early as possible.
- Targeted Support: Allows resource prioritization based on risk profiles (e.g., flat residents with low focus).
- Curriculum Adaptation: Insights on education board performance can guide teaching strategies.
- Engagement Design: Emphasizes the role of interactive learning over attendance mandates.